New Hampshire Property Tax Rates 2016

Quote

property taxesAt the end of every year, around October, our state releases the new property tax rates for the year.  BUT, tax rates are just part of the story for determining your property taxes.

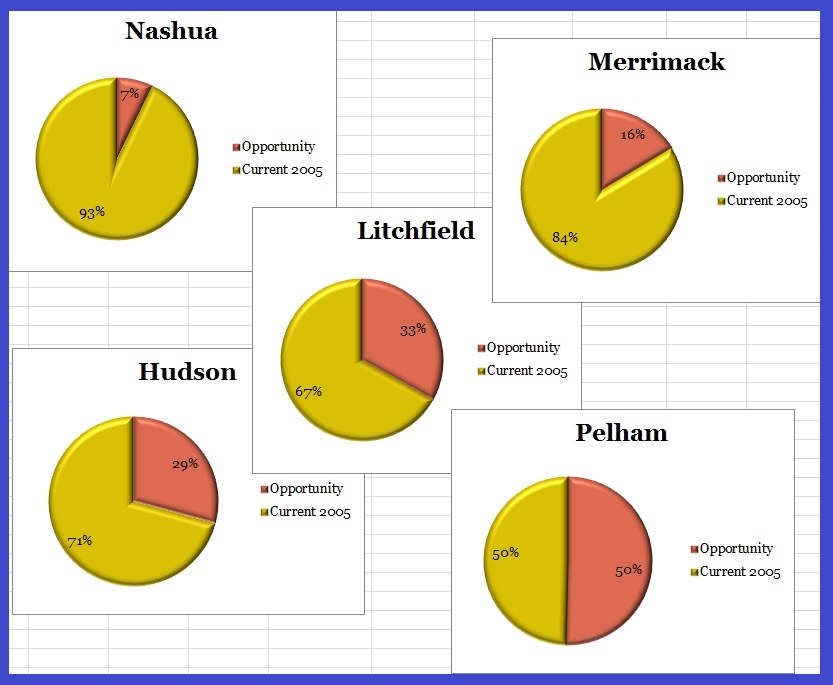
There may be an Equalization Ratio that needs to be applied to the value of your home, and this is determined by how close your house’s Assessment is VS the Market Value. What’s an equalization ratio: http://jennifercote.info/how-is-an-equalization-ratio-used-in-nh-property-tax-calculations/

$YOUR TAXES$ =  (ASSESSED VALUE * TAX RATE)/1000

Below is a list of a few southern New Hampshire towns.  For the statewide list go to: NH Department of Revenue Administration.
(A higher tax rate doesn’t necessarily mean that town charges more in taxes.)

Southern NH 2016 Tax Rates

Per $1,000

Amherst $25.10
Derry $27.06
Hudson $21.97
Litchfield $21.60
Londonderry $21.50
Merrimack $22.79
Hollis $23.43
Milford $28.96
Nashua $25.07
Pelham $20.95
Salem $20.43
Windham not in yet

-Just my thoughts. Jenn

Post Footer automatically generated by wp-posturl plugin for wordpress.

How Is An Equalization Ratio Used In NH Property Tax Calculations?

Quote

Reconcile

First, what is it? “Equalization is the process where the state makes adjustments to each municipality’s locally assessed values to calculate the estimate 100% value of the municipality.” NH Dept. of Revenue Administration

Simply put, it helps adjust your real estate’s assessed value to meet the current market value.   Sometimes the assessment may not be up to date.  Your town assessor determines what your real estate is valued at using different techniques than an appraiser.  It’s not updated as quickly as the real estate market changes and why the assessment ratio is needed.

So to balance out the difference, and bring the assessment up to market value, the ratio is applied and that value is used to determine your total property tax…not the assessment value.

Total Assessed Value (AV)
Total Market Value (MV)
= Equalization Ratio

If the town is at a 100% equalization ratio, then the Assessed Value is what’s applied to the tax rate.

You can find the equalization ratio’s by municipality on the
Department of Revenue Administration’s website:

2015 : http://revenue.nh.gov/mun-prop/property/equalization-2015/index.htm
2016’s will not be done until early 2017, after all the tax rates are determined: http://revenue.nh.gov/mun-prop/property/equalization-2016/index.htm

-Just my thoughts, simply.  Jenn

Post Footer automatically generated by wp-posturl plugin for wordpress.

Pelham High School Homecoming Weekend 2015

Quote

PelhamForGodandCountrySquare

For God and Country

I was going to post my flyer below about the Library Book and Bake Sale this weekend on Facebook. I’m a parent evangelist for the Boy Scout’s, and they are hosting the bake sale. Lot’s of homemade goodies…the gluten free peanut butter cookies are my creation.

To the point, this weekend is also Pelham High School’s homecoming weekend. I received an email this morning; the activities are pretty great!   I could not find a link to the activities so thus the post.  Get out this weekend, there’s lots to do in Pelham!

PelhamNHhigh

HS Addition Open House:  The HS will be giving tours of the new addition Saturday, September 26 at 10am and 1pm.  All are invited!

Friday September 25th

  • 4:00pm:  Varsity Field Hockey vs John Stark ( Harris Field )
  • 5:15pm:  JV Field Hockey vs Souhegan ( Harris Field )
  • 5:00pm:  JV Volleyball vs West ( PHS Gym )
  • 6:15pm:  Varsity Volleyball vs West ( PHS Gym )
  • Annual Student Bonfire- DJ, Dancing, games and Cash BBQ- Sponsored by the Class of 2017

Saturday September 26th

  • 8:30am:    Homecoming Athletes Breakfast ( PHS Café ) All Athletes, Alumni and Staff Invited
  • Henna Tattoos and Rally towels- all day- Sponsored by the Class of 2018
  • Glow Sticks and Novelty Items all day- Sponsored by the Class 2019
  • Mattress Sale in the gym all day – Sponsored by the PHS Band
  • Tile Painting in the café 10am-5pm- Sponsored by National Honor Society
  • Homemade Chowder sales 10am-5pm – Sponsored by the Robotics club
  • Spirit Bracelets, Balloons and Cookie sales all day- Sponsored by the Drama Club
  • Tours of the New PHS Building will be held at 10am and 1 pm
  • 10:30am:  Boys JV Soccer vs Pembroke Academy ( PHS Soccer Field )
  • 12:00pm:  Girls JV Soccer vs Windham ( PHS Soccer Field )
  • 1:30pm:    Girls Varsity Soccer vs Windham ( PHS Soccer Field )
  • 3:30pm:    Boys Varsity Soccer vs Farmington ( PHS Soccer Field )
  • 6:00pm:    Football Game vs Milford ( Harris Field )

Just my thoughts. -Jenn

BoyScoutBakeSale

Post Footer automatically generated by wp-posturl plugin for wordpress.

New Hampshire 2014 Property Tax Rates

I just updated my webpage at www.TopNHhomes.com with the current list of NH property tax rates: http://topnhhomes.com/nh-tax-ratesNH Tax Time

Why your assessed value is not usually your market vale and what is an equalization ratio explained.

Please take a look.

Jenn

Post Footer automatically generated by wp-posturl plugin for wordpress.

Land Use, Development Potential, and How Important it is in Real Estate

Quote

Region-wide Buildout Impact Analysis from the Nashua Regional Planning Commission.  Thank you Jen Czysz for helping me find this study.

There are areas in southern NH that are ripe for development.  I happen to be working on a group of properties in Litchfield and was doing an analysis on vacant land.  It got me thinking of what the development potential is in the surrounding towns.  Read the conclusion…you’ll like it too if you don’t fall asleep.


According to the town of Litchfield, NH’s Master Plan (Table V111-2 p.9) there are: 5,620 acres of land in-use(built upon), 1,541 acres constrained(cannot develop), and 2,622 acres are unconstrained (able to develop).  This data is from 1999, yeah it’s old.

LitchfieldPieChart


Build-out analysis is one step in the land use planning process to help municipalities plan for growth.   “Buildout is a theoretical condition and exists when all available land suitable for residential and nonresidential construction has been developed.”*  http://www.nashuarpc.org/files/5713/9463/5247/Regionwide_buildout_final.pdf

The charts below give you a better perspective of what may be available to develop.  Many towns have a proactive zoning ordinance that tracks the growth and can restrict building permits if/when the infrastructure cannot meet the needs.

The top, Nashua, has the least availability…the 2nd largest city in NH by population, no surprise.  I was completely taken back by Pelham…I double checked: 50%?  Read the NRPC PDF which explains the process of what factors they used.  Note: the data is from 2005, this would change if the town zoning requirements where modified otherwise it should keep fairly consistent being a percentage.

BuildoutGraph5towns

BuildOutTotals

Data from NRPC Regional Build-out Study- link above

So all of these towns/city are in southern NH…easy commute to Boston.  Why do Pelham, Litchfield, and Hudson have so much potential?  Look at a map…highway access!! 

SO REMEMBER…widen a highway, and you will have a lot of new development in these towns.

-Just my thoughts.  –Jenn


Post Footer automatically generated by wp-posturl plugin for wordpress.

Real Estate and GIS Maps for Southern NH Communities

Quote

It’s me again.  Don’t you just love researching real estate!  No?  Then you should call me to help you.  My email and phone are on this site somewhere.

So let me tell you about one of my favorite resources: Geographical Information Systems or GIS for short.  It basically a large data organizer that government (municipal, defense, intelligence), universities, health, and so many more use to easily visualize large quantities of data and their relationships.

For real estate/municipality purposes it takes different property maps such as a map for lot dimensions, zoning, water lines, conservation areas, and overlays them together for easy searching and viewing.

Livingston Park in Manchester, NH Data

Livingston Park in Manchester, NH Data – Click to Enlarge

Find the municipality’s website and many will have an interactive GIS mapping system.

Here are a few municipal GIS mapping sites(make sure your pop-up blocker is off):

Nashua: http://www.gonashua.com and you need to click on “Go to GIS maps” and it will open up in another window.

Windham: http://www.windhamnewhampshire.com (check this out Jeff)

Manchester: http://208.82.76.123/pubgis/ (this one’s for you Dave)

__________________________________________________________

These are some PDF maps from the Nashua Regional Planning Commission(NRPC): http://www.nashuarpc.org/gis/mapsets.htm
The towns in the NRPC include: Amherst, Brookline, Hollis, Hudson, Litchfield, Lyndeborough, Mason, Merrimack, Milford, Mont Vernon, Nashua, Pelham, and Wilton.

Here is the Rockingham Planning Commission site for additional maps: http://www.rpc-nh.org/ and the towns include: Windham, Salem, Atkinson, Plaistow, Hampstead, Kingston, Danville, Sandown, Hampton, Freemont, Brentwood, Seabrook, Exeter, Portsmouth, Rye.

-Just my thoughts.  Jenn Cote Everything Real Estate

Post Footer automatically generated by wp-posturl plugin for wordpress.

Tax abatement time.

To help you decide if a tax abatement is warranted you should first double check the physical data on the tax assessment card.  In many cases the tax card may show items incorrectly.  If you need help reading the tax card give me a shout; it can be confusing.

The second thing to look at is market data for the property which shows that the property is over-assessed.  This is based on the equalized assessed value of the property as of April 1st. Since most municipalities do not reassess property each year, an equalization ratio for every municipality is established by the state.  This ratio is not usually published until the following year.

In order to calculate what the municipality states the property is worth in a given tax year, divide the total assessed value by the equalization ratio.  For example, if the tax assessment card indicates an assessed value of $250,000 and the current equalization ratio is 92% then the equalized assessed value of the property calculates to $230,000 ($250,000 ÷ 0.92). The $230,000 amount is what should be used as a basis for determining whether or not the property is over-assessed.

Is the property disproportionately assessed when compared to other properties within the municipality?  Municipalities use mass appraisal techniques. Generally speaking, cost and sale data are collected and analyzed. Rates are then established for various property types and adjustments are made for specific property characteristics. Mass appraisal techniques are utilized to assesses thousands of parcels in a municipality. In most cases, the end result of the assessment using mass appraisal techniques should be similar to the result of an appraisal.  This would be a problem if your house is the smallest in a neighborhood of McMansions.  Your assessment would most likely be overstated due to the market data pulled from the neighboring homes.  An appraisal would pull homes from other neighborhoods that are more comparable to the subject, taking into consideration the subject’s overall superior neighborhood.

The appraisal process differs significantly from the assessment process. Rather than collect data and apply it to a large sample of properties in a municipality, the appraisal focuses on one specific property. Cost, sale, and income (if applicable) data are utilized in developing the three approaches to value: cost, sales, and income capitalization. In an appraisal, market data is also analyzed outside the town. These three approaches are developed and then reconciled into a final value conclusion for the subject property.

Check out my website for more information on tax abatements:

www.JACoteAppraisals.com

Thanks for reading!

Post Footer automatically generated by wp-posturl plugin for wordpress.