Todays Nashua Market Trend Update

Quote

Market Trend update for February 2015

Current Nashua NH Real Estate Market Report February 2015

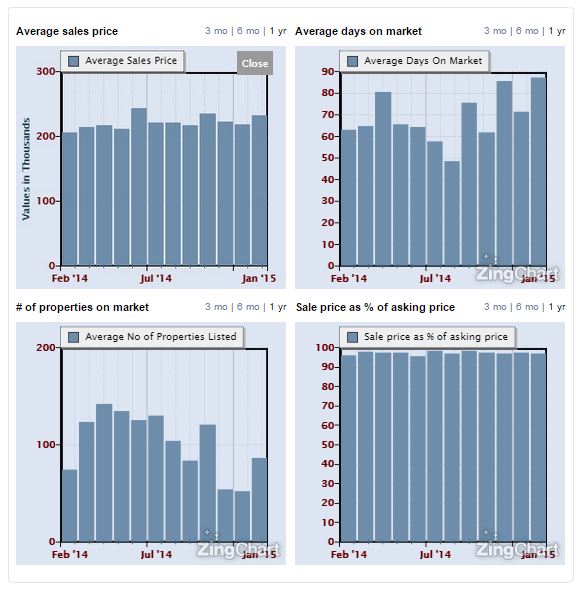
The Nashua NH real estate marketed report February 2015 indicates a 12 month trend from January 2014 of average sales prices increasing and declining inventory. Declining inventory is typical over the winter months.

Nashua NH Average Sales Prices

The current trend is upward and indicates the average sales price of $232,000 with days on market of 87 for January. In February of 2014 the average sales price was $207,000 with 97 days on market.  Can you imagine if we did not have all this snow on the ground?

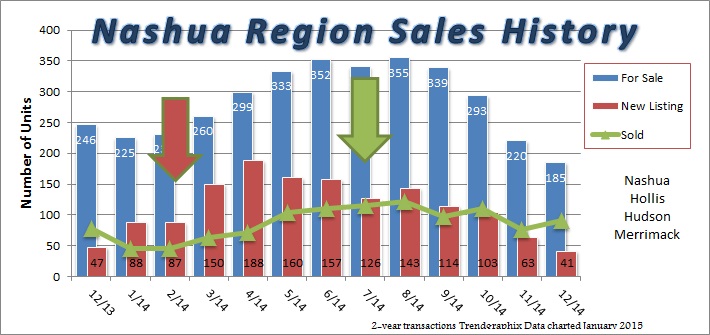
Nashua NH New Property Listings

The trend for properties on the market is slightly higher than last February with 75 listings, January this year has 87 listings.  The spring market listings have been delayed due to the severe winter snow storms. March and April we typically see the largest influx of new listings.

Nashua NH Real Estate Market Report

Nashua NH Real Estate Market Report

Post Footer automatically generated by wp-posturl plugin for wordpress.

Is spring the best time to list your house for sale?

Quote

When does the spring market start?

When does the spring market start?

While spring typically has the most closings, it is not necessarily the best time to LIST your house for sale.  The graph below shows a 1-year history of properties for sale, sold, and new listings on a month to month basis in the Nashua region (Nashua, Hudson, Hollis, and Merrimack).  The red arrow points to the new listings on the month just before the inventory grew. The green arrow is when home closings where highest.

The best time to list a house for sale.

Nashua, Hollis, Hudson, Merrimack Sales History

Nashua, Hollis, Hudson, Merrimack Sales History

A large increase of homes came on the market in March(red arrow), which equates to more competition for a house listing.  The months from May to August you see closings (green arrow).  Since the time for a real estate transaction, from new listing to closing, can typically take 60-120 days (2-4 months) it makes sense the best time to list is the 3 months prior to the peak in closings.


So when is the best time to list a home for sale? The chart says: March through May, with early March being the tops. The market slows down considerably in August, so keep that in mind. This cycle is typical in New Hampshire.


-Just my thoughts. -Jenn

 If you would like a free market analysis of your home please fill out the form below.

The Nashua area real estate market. Merrimack real estate for sale. Hudson home for sale.


Post Footer automatically generated by wp-posturl plugin for wordpress.

Happy Pie Day – 2014 Home Sales in Greater Nashua

Quote

In CELEBRATION of NATIONAL PIE DAY,…some pie charts.

Home sales in Nashua, Hudson, Merrimack, and Hollis New Hampshire by price range.


 Are home values increasing? 2014 versus 2013 homes sales.

Greater Nashua Home Sales by PriceOver half of 2014 home sales were under $250,000. Compared to 2013, we see no change for prices over $400,000, but a 4% increase in sales between $300-400K and a 4% decrease in price points under $300,000.2013homesalesbypricechart

Does this mean home values are increasing?  There are many factors that go into play for determining increases, and this is just one.

HAPPY PIE DAY!

Just my thoughts. -Jenn

*Data from Trendgraphix, Inc. Charted 2015

Post Footer automatically generated by wp-posturl plugin for wordpress.

Real Estate Update for Windham, NH

Quote

Real Estate Market Update for Windham, NH

The town voted by Money Magazine as one of the top 30 in the US.  Here’s some stat’s: http://time.com/money/2791444/30-windham-nh/


Absorption Rate

You mean more people are buying in Windham? Surprise, surprise.


While values are remained fairly stable, you can see a large decline of new listings.

While values are remained fairly stable, you can see a large decline of new listings.

Post Footer automatically generated by wp-posturl plugin for wordpress.

Market Update for Pelham, NH

Quote


Pelham, NH 106th Old Home Day Parade

Pelham, NH 106th Old Home Day Parade

It’s about time I did some graphs for Pelham.  After all, I’ve been living here for over 2 years now (time flies).  Since moving here the Pelham market has only just come out of it’s slump at the beginning of this year.

It’s looking solid in the Pelham NH real estate market! Below are 2 graphs I ran on properties for existing single-family homes in the previous 6 years.  Higher end properties have finally started to sell, huge increase in activity, the days on market to sell has gone down, and you won’t catch me saying prices are going up…but, multiple offer situations in entry-level homes have been happening.

That’s a significant upswing in pending home contracts in the last few months.

Look at that obvious seasonal real estate CYCLE!


The next graph shows the decrease in the days on market- the time it takes to sell a property in Pelham.  Seeing the large decrease this year indicates an increase in demand.

The days on market in Pelham have gone way down this year!

  Just my thoughts.  –Jenn  


Contact Me At: 603-821-8285 or Jenn@TopNHhomes.com
____________________________________

www.TopNHhomes.com

www.JACoteAppraisals.com

RE/MAX Properties – 169 Daniel Webster Hwy Nashua, NH 589-8800

J.A.Cote Appraisals, LLC – 142 Lowell Rd Hudson, NH

Real Estate in Pelham, Nashua, Salem, Merrimack, Amherst, and Windham.

Post Footer automatically generated by wp-posturl plugin for wordpress.

Nashua NH Real Estate Trend Report

Aside

Nashua 3-year Market Report for Real Estate

-using existing construction-


April 2013 Real Estate Trend

April 2013 Real Estate Trend – CLICK IMAGE TO ENLARGE

Notice all the listings FOR SALE….then notice the downward trend of listings over the last few years. Then notice the pending listings(listings that are under contract), and lastly the sold column.

Conclusion: Inventory has been decreasing, listings under contract going up, and then the sales, year over year comparison, have also been going upLower inventory and more activity make for a good market!

If you’d like to know when I post another article on this topic “like” my Facebook page: www.facebook.com/TopNHhomes

Just my thoughts.  –Jenn 

Contact Me At:

603-821-8285 or Jenn@TopNHhomes.com

www.TopNHhomes.com
www.JACoteAppraisals.com

RE/MAX Properties – 169 Daniel Webster Hwy Nashua, NH 821-8285 
J.A.Cote Appraisals, LLC – 142 Lowell Rd Hudson, NH 


Properties for sale in Nashua. Hudson real estate. Merrimack new construction. Amherst antique homes. Pelham properties for sale. New listings in Windham.

Post Footer automatically generated by wp-posturl plugin for wordpress.

Market Update in NH – Real Estate

Time for another market update.  What’s going on?  I decided to expand my data to include all of Hillsborough county, NH.  Some of the towns in Hillsborough are: Amherst, Bedford, Hollis, Hudson, Litchfield, Manchester, Merrimack, Milford, Nashua, and Pelham.

Hillsborough County 2 year Real Estate Trends

Hillsborough County 2 year Real Estate Trends

May and June are the busiest months in New Hampshire.  This chart shows 3 years of June activity.  What’s real interesting is this year and 2010** are similar in sales, but pending listings have jumped up this year!  That means in the next 2 months you are going to see a large increase in closed sales over the last 2 years.

This is great news for the real estate market!  The market has stabilized, many towns in this area are experiencing multiple offer situations, marketing times have decreased, and interest rates are crazy low!

Percentage Change in Real Estate

Percentage Change in Real Estate – click to enlarge

**Let’s not forget, 2010 was the year of the tax credit for new buyers which artificially inflated the activity that year.

Post Footer automatically generated by wp-posturl plugin for wordpress.

Nashua Market Trends

So what’s going on in Nashua?  Let’s compare last years first quarter with this years.  New listings are up 17%, Solds are up 8%, and Pendings are up a whopping 20.5%.

What’s really interesting here is you can see on the graph that the new listings and pending listings are coming closer together, and just may intersect this year.  Why is this important?

Notice last years inventory grew at a larger rate than those going under contract…it caused an oversupply.  Listings are moderately increasing, while pendings are dramatically increasing.  The inventory is balancing out, and the graph is showing that!

Nashua Market Graphed


This is great, but we still have quite a few existing listings to work through. Right now Nashua is a hotbed of activity.  It a property is priced right, and in good condition, it will typically sell in 3-6 months. A balanced market will typically have 3-6 months worth of inventory on the market.

Looking for more information about Nashua?  Give me a call: 603-305-1922 or email: Jenn@TopNHhomes.com
 

Post Footer automatically generated by wp-posturl plugin for wordpress.

Hudson NH Real Estate Trends

The Old Bensons Animal Park - Hudson, NH


What’s going on in Hudson?  The spring market hit well over a month ago (the spring real estate market starts in February or March) and looking at the graph below you can see the increase in listings going under contract.

Hudson New Hampshire Market Trends

Once a property goes under contract it will typically close in 60 days, so the increase in contracts will make the next couple months show a large increase in sales.  Just look at January and Febuary of last year.

The active listings show 4 months of inventory….a stable market typically has 3-6 months active inventory.

Looking pretty good!

-Just my thoughts…Jenn

Top New Hampshire Homes

Post Footer automatically generated by wp-posturl plugin for wordpress.

Real Estate Prices to Fall in 2011?

Just read this Inman News article by Steve Bergsman http://www.inman.com/buyers-sellers/columnists/stevebergsman/real-estate-prices-fall-least-5-in-2011. It had a great analysis of the housing market. We all want a recovery of the housing market, it is a key indicator to a healthy economy. But are we being too optimistic?

Reliable trend analysis can only be established with a large data set over a longer period of time: 1-3 years. I leave the “forecasting” to the economic experts…it is basically an educated guess. I am in the trenches and can come up with my own hypothesis on continued trends, but it is more specific to my areas of expertise…southern NH. Things have been fairly stable, entry level properties in good condition sell quick, investors are busy buying and flipping, the mortgage market is loosening up, and consumer optimism is increasing.

There are so many excellent points in this article, but every area is different. We are in the slowest time of year for southern New Hampshire real estate: winter. In areas with severe winter conditions the fluctuations between seasons can be large. Therefore short trend analysis is unreliable and possibly misleading and may or may not reliably indicate the future market trends. The coming spring market is just around the corner and without the artificial boost from last years tax credit we will get a more accurate picture of the real estate health.

So I am waiting until spring to give-up on my real estate recovery. Call me an educated optimist…

-Just my thoughts.

www.TopNHhomes.com
www.JACoteAppraisals.com

Post Footer automatically generated by wp-posturl plugin for wordpress.